The platform
The mygreenspace.net platform was born out of the goal of estimating the health potential of urban green spaces, namely their potential to contribute to the health of European city dwellers.
This tool aims to:
The mygreenspace.net platform is designed to be a decision-making tool for municipalities that want to optimize the greening of their urban spaces and the development of their parks and gardens with the dual objectives of promoting the health of city dwellers and mitigating the effects of climate change.
It has been developed as part of the European Joint Action PreventNCD (non-communicable diseases) project led by the European Commission from 2024 to 2027. The aim of this project is to combat cancer and non-communicable diseases such as cardiovascular and respiratory diseases, diabetes, etc. by acting on health determinants, including the residential environment. It is based on research conducted on urban green spaces at the EHESP (School of Advanced Studies in Public Health), particularly in the context of the GreenH-City (2017-2022) and Greencan (2022-2026) projects funded by the INCA (French National Cancer Institute).
The health potential of urban green spaces
The proposal for a tool to estimate the health potential of freely accessible urban green spaces for municipalities was based on the scientific consensus surrounding the health benefits of green spaces. These benefits relate to physical, mental, and social health, as well as the general well-being of individuals. They stem from the four essential health functions of green spaces, some of which can be broken down into several dimensions:
the function of developing individual capacities (F2) in relation to physical activity, social interactions, and food awareness,
the function of individual rejuvenation (F3), restoring attention and mood, and reducing stress,
the function of preserving and developing biodiversity (F4).
These four functions are developed to varying degrees depending on different factors specific to the green space, such as its size.
They will have a greater impact on health if the green space is used more or less regularly and for longer periods of time by city dwellers, which depends on its accessibility and attractiveness (ACCESS & ATTRACTIVENESS):
To learn more...
You can consult:
Start exploring: tips for using My Green Space effectively
From the My Green Space navigation menu:

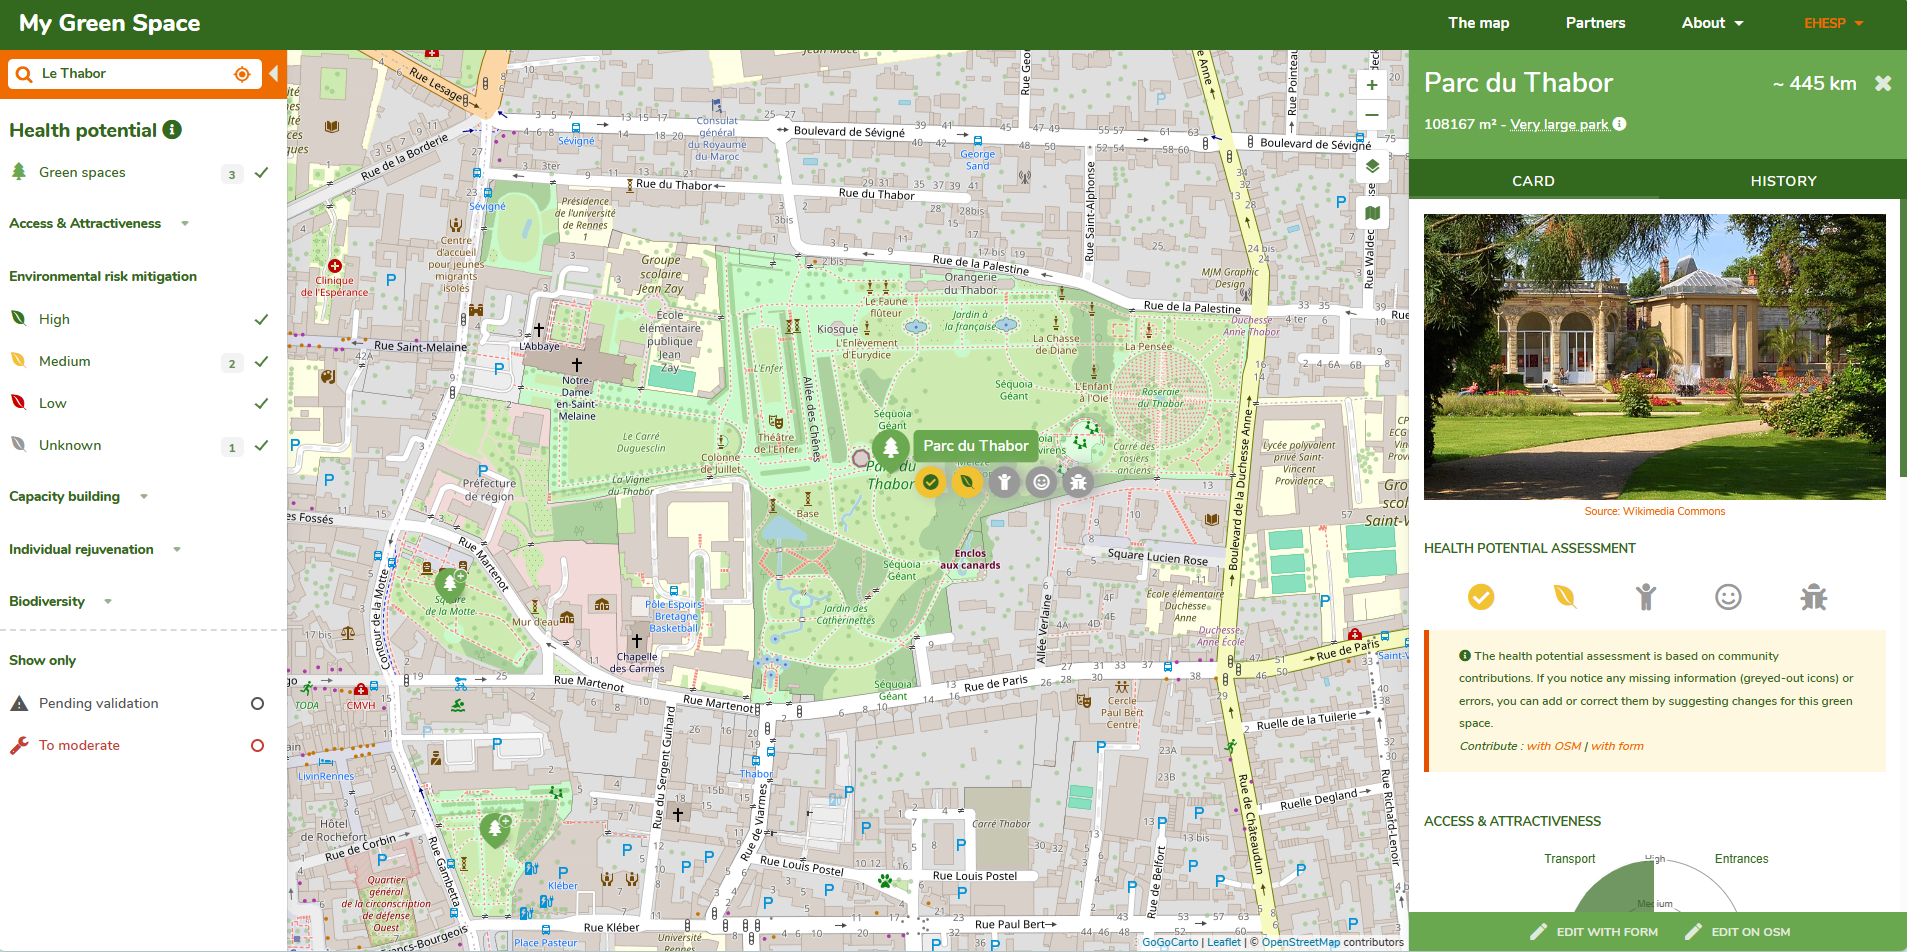
In the left sidebar, you’ll find details about the Health Potential of all urban green spaces shown on the map. Use the drop-down menus — Access & Attractiveness, Environmental Risk Mitigation, Capacity building, Individual rejuvenation, and Biodiversity — to explore how green spaces are distributed across these dimensions. Each space is classified by its potential: high, medium, low, or unknown.

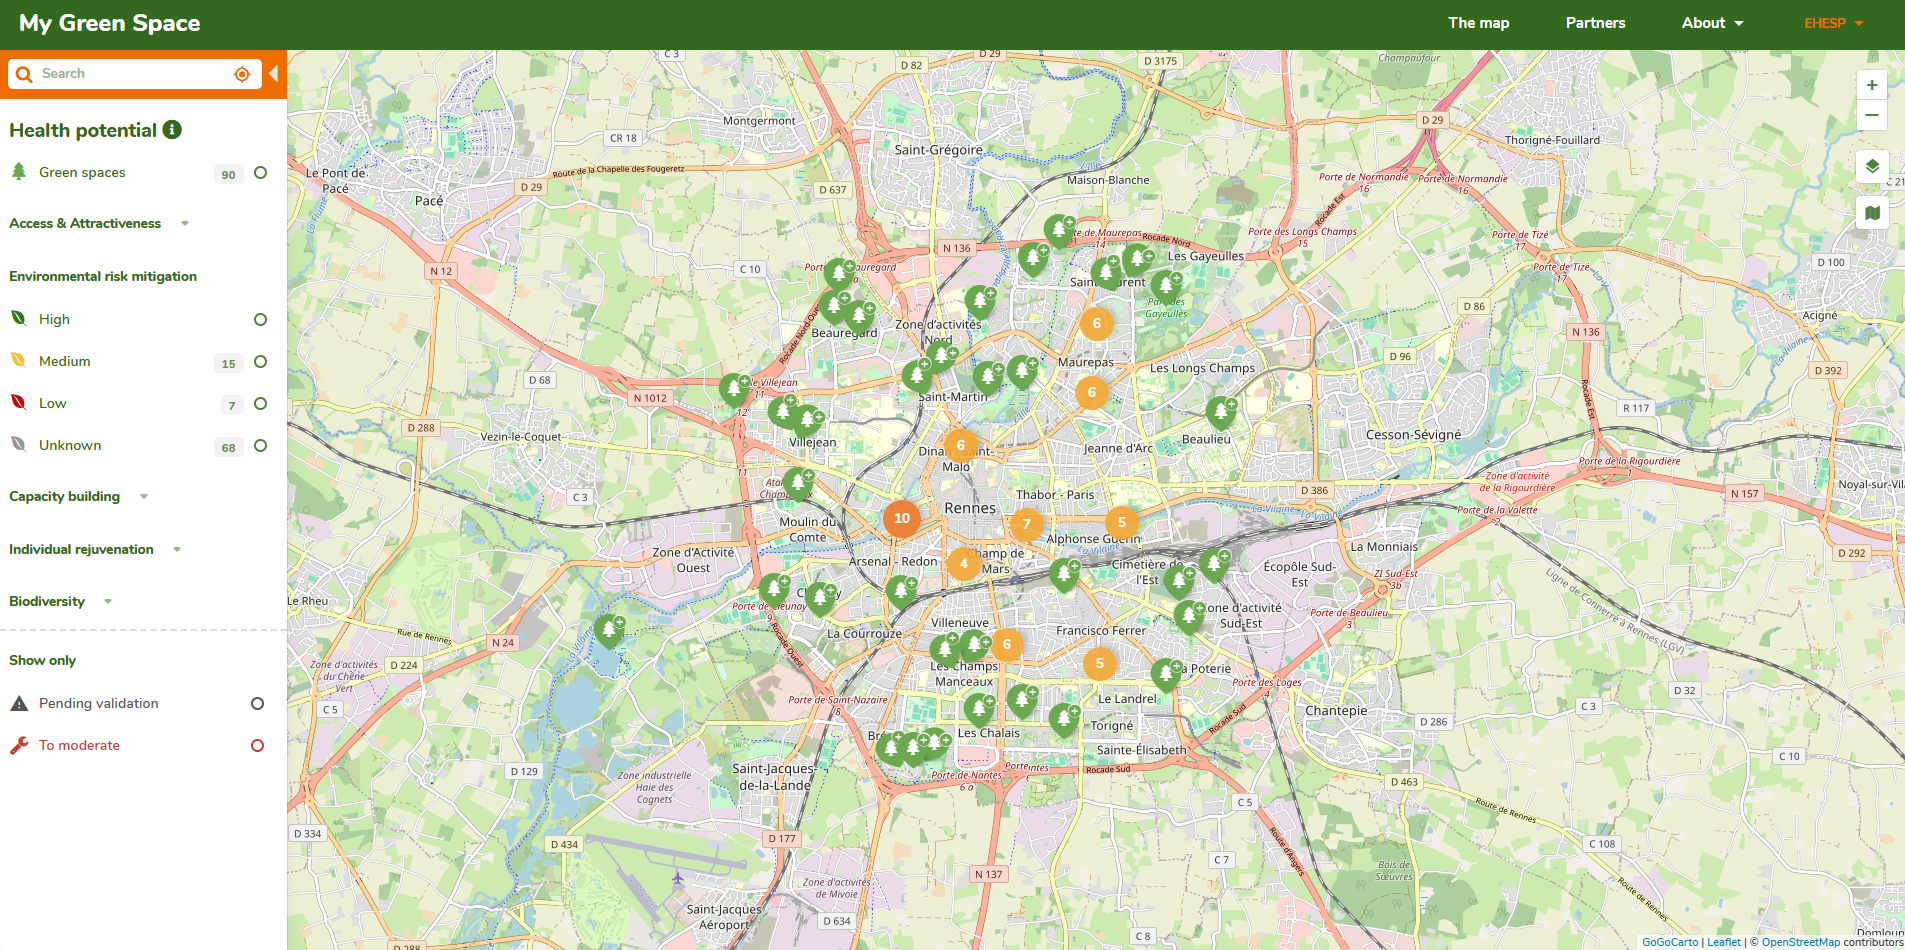

In the example above, the city of Rennes has 90 green spaces listed in the My Green Space database. Of these, 15 have a medium potential for reducing exposure to environmental risk factors, 7 have a low potential, and 64 have an unknown potential. This means that, for these 68 green spaces, the current data is not sufficient to calculate their environmental risk mitigation potential.
Once the data is complete, it will enable a full assessment of each green space’s capacity to:
Dynamic calculations based on the selected zoom level also make it possible to evaluate the health potential of green spaces at the scale of a neighborhood or any defined geographic area.
At the top of the left sidebar, the Search box lets you find a green space by name — for example, Le Thabor in Rennes. When you select it, a panel appears on the right side of the page, showing the health potential of the chosen green space. You can also access this information by clicking the tree icon linked to that green space on the map.
The health potential of a green space is summarized through icons representing its accessibility/attractiveness and its four health-related functions. Their colors (green, orange, red, and gray) vary according to the estimated level for each dimension of the green space’s health potential:

The health potential of a green space is presented in detail through three polar area charts:
The completeness of these charts depends on the data available at the time of calculation.
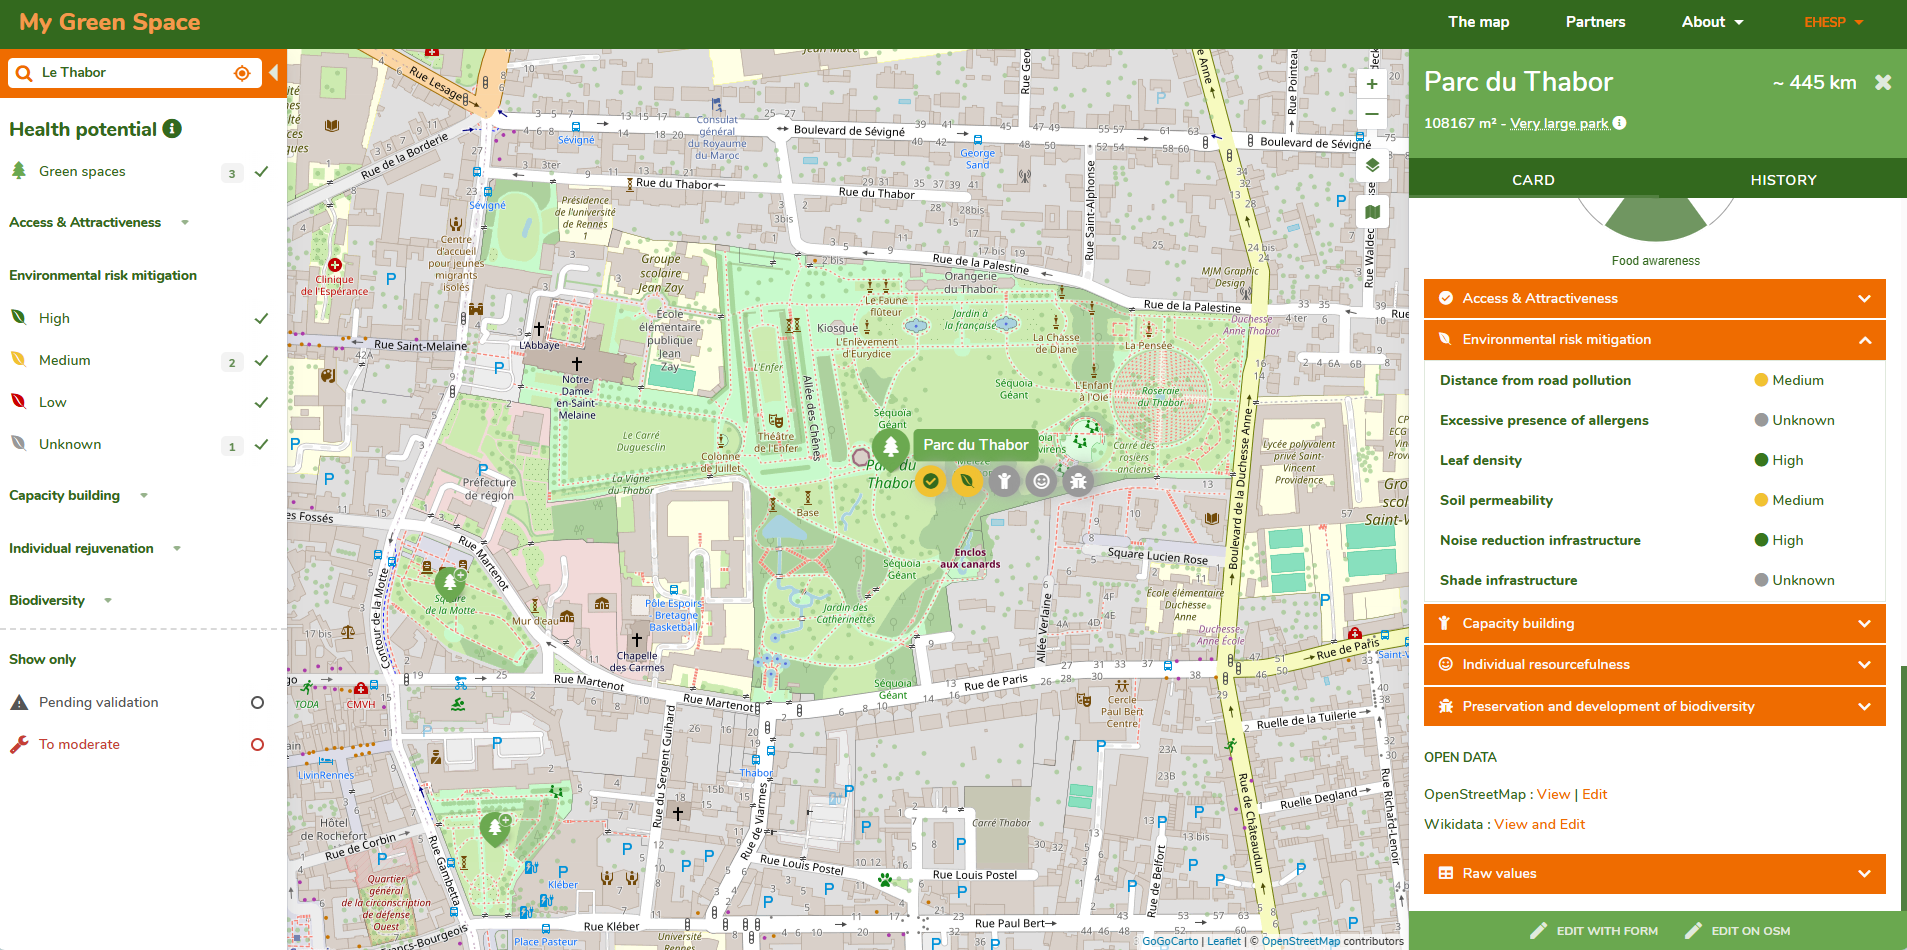
The indicators used to calculate the health potential of an urban green space are available in the drop-down menus below the charts, while their raw values can be accessed through the Raw Values menu. You can also view the Open Data linked to each green space.
The data used to calculate green space indicators is participatory, and you can help enrich and improve it!
We rely on two main sources:
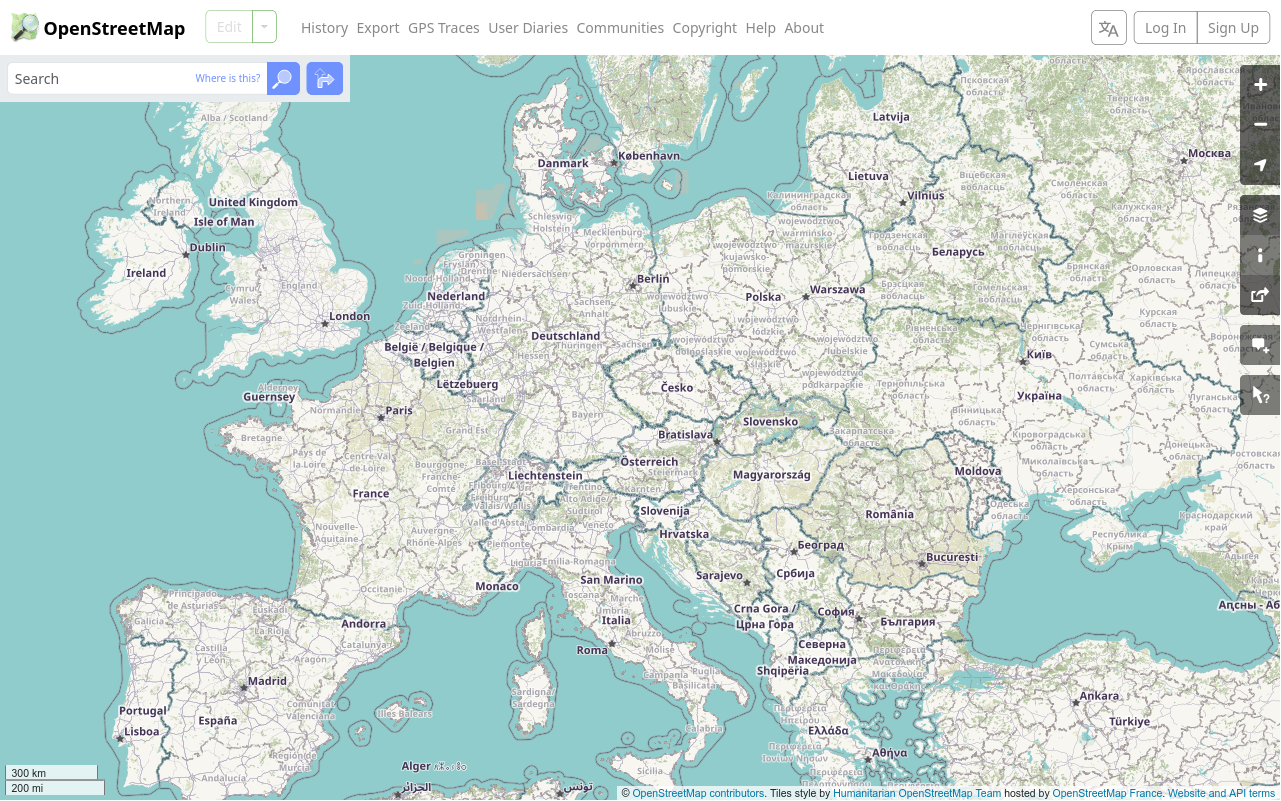
OpenStreetMap is an open, collaborative map that helps describe living environments across the globe. Every day, it is enriched by contributions from over one million people worldwide (learn more).

It allows you to catalog and geolocate the physical elements that make up public spaces in cities—streets, trees, benches, streetlights, shops, and of course, green spaces! This makes it an excellent source of data for our map. Since this is a collaborative project, anyone can contribute. If you notice missing or incorrect information, you can update OpenStreetMap and help enrich the data available for MyGreenSpace.
To do this, go to openstreetmap.org. Click Sign Up (top right) and create your OSM account by following the instructions. Once registered, log in with your new account by clicking Log In (top right).
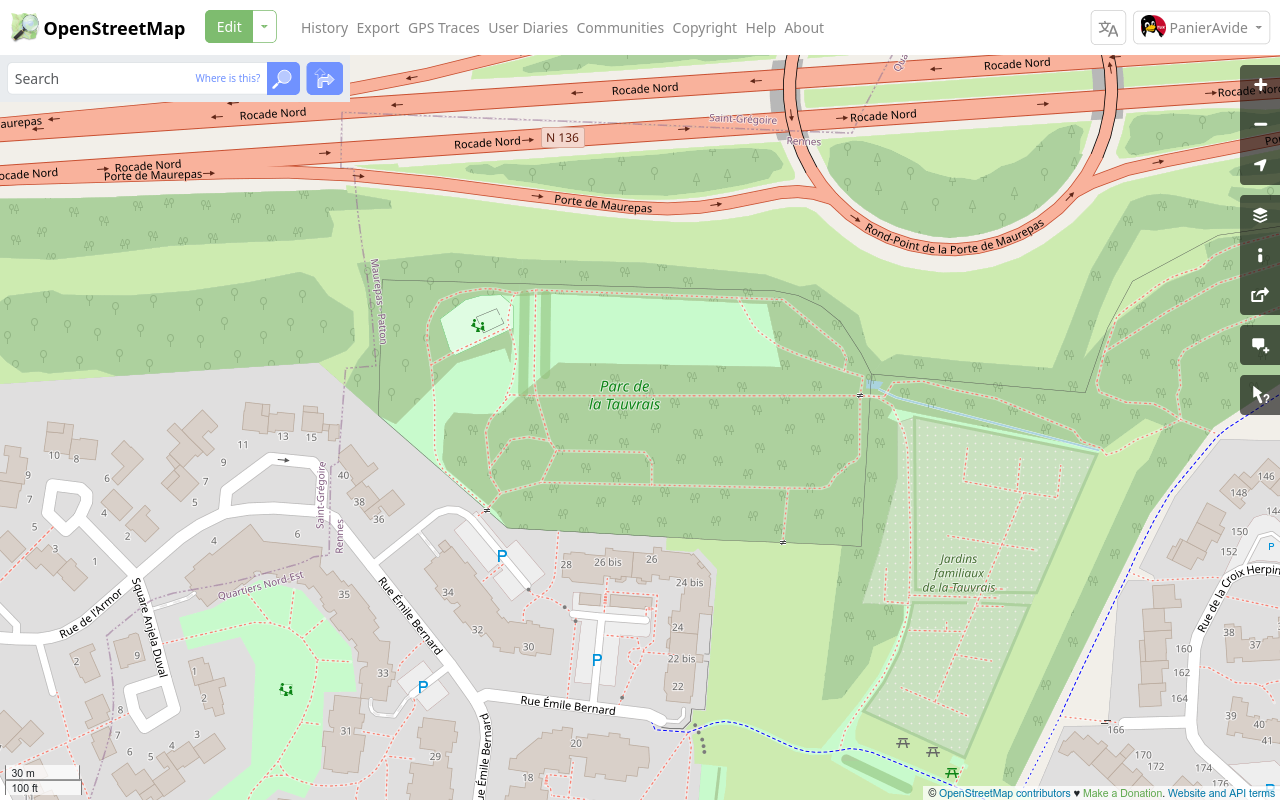
You can find a green space by typing its name in the Search bar (top left) or by moving the map to the area you want to edit. Zoom in until it is clearly visible, then click Edit (top right).

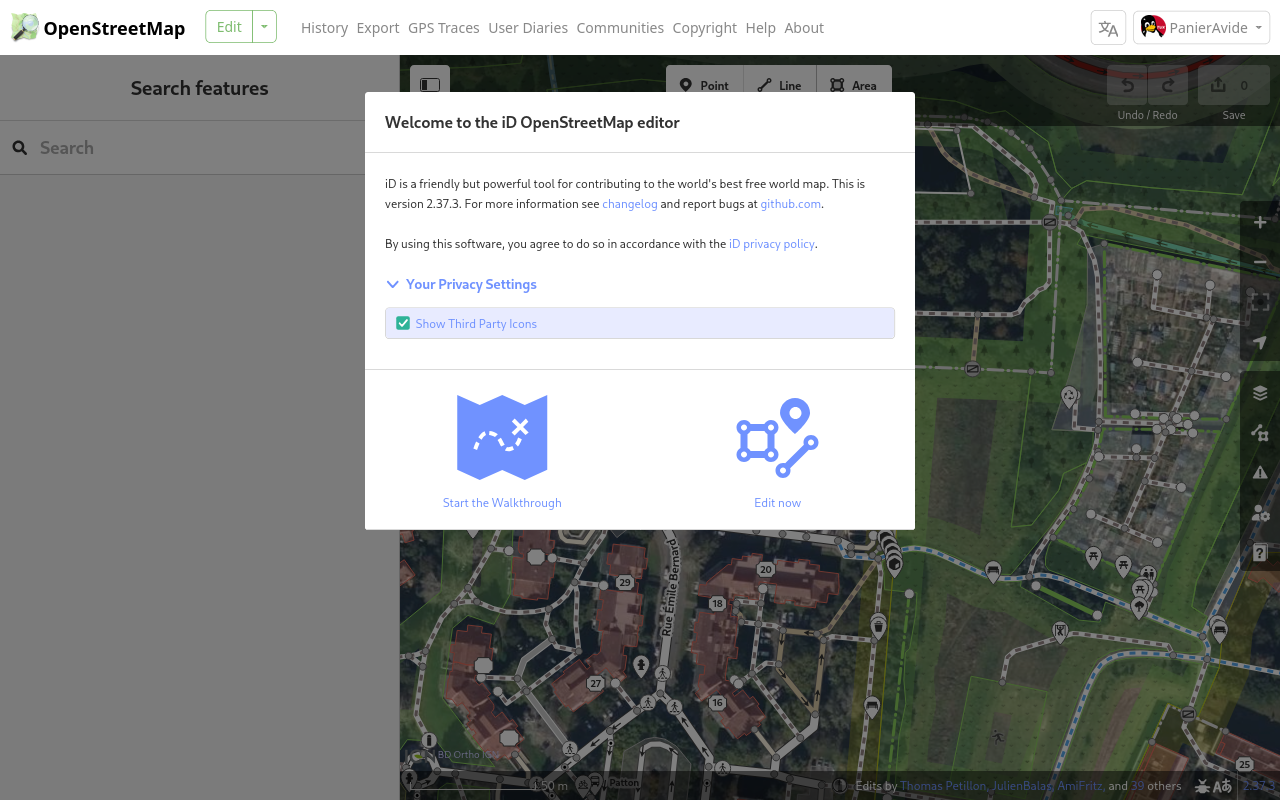
You will then enter OpenStreetMap’s web editor, called iD. It offers an easy-to-use interface for editing map data. On your first visit, a short tutorial will be suggested to help you learn the basics of contributing. We strongly recommend following it to fully understand how the editor works.

You can also check out LearnOSM’s English tutorial on how to contribute using the iD editor.

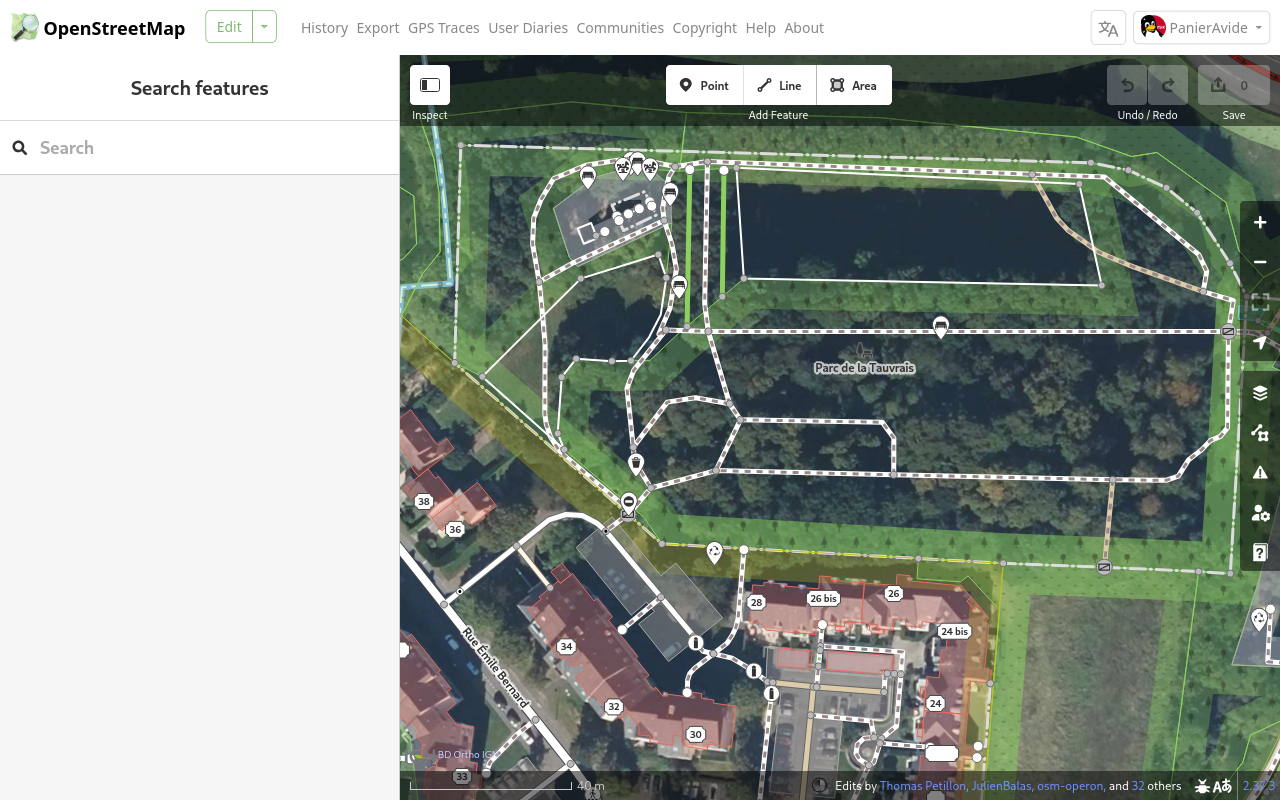
The health potential indicators for green spaces are based on a specific set of features recorded in OpenStreetMap.
Here is the list of features we recommend you include:
| Photo | Name in iD | Type in iD | Documentation |
|---|---|---|---|
| Park | Area | leisure=park | |
| Pedestrian path | Line | highway=footway | |
| Tree | Point | natural=tree | |
| Row of trees | Line | natural=tree_row | |
| Managed forest | Area | landuse=forest | |
![]() |
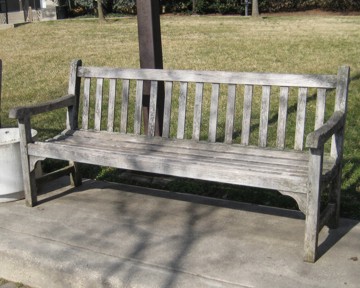
Bench | Point | amenity=bench |
![]() |
Picnic area | Area | tourism=picnic_site |
| Drinking water | Point | amenity=drinking_water | |
| Toilets | Area, Point | amenity=toilets | |
![]() |
Viewpoint | Point | tourism=viewpoint |
| Children's playground | Point, Area | leisure=playground | |
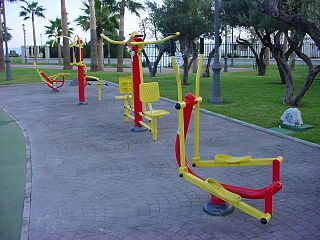
| Fitness trail | Point, Area | leisure=fitness_station | |
| Sports field | Area | leisure=pitch | |
![]() |
Grass | Aera | landuse=grass |
| Allotment gardens | Area | landuse=allotments | |
| Bicycle parking | Point | amenity=bicycle_parking |
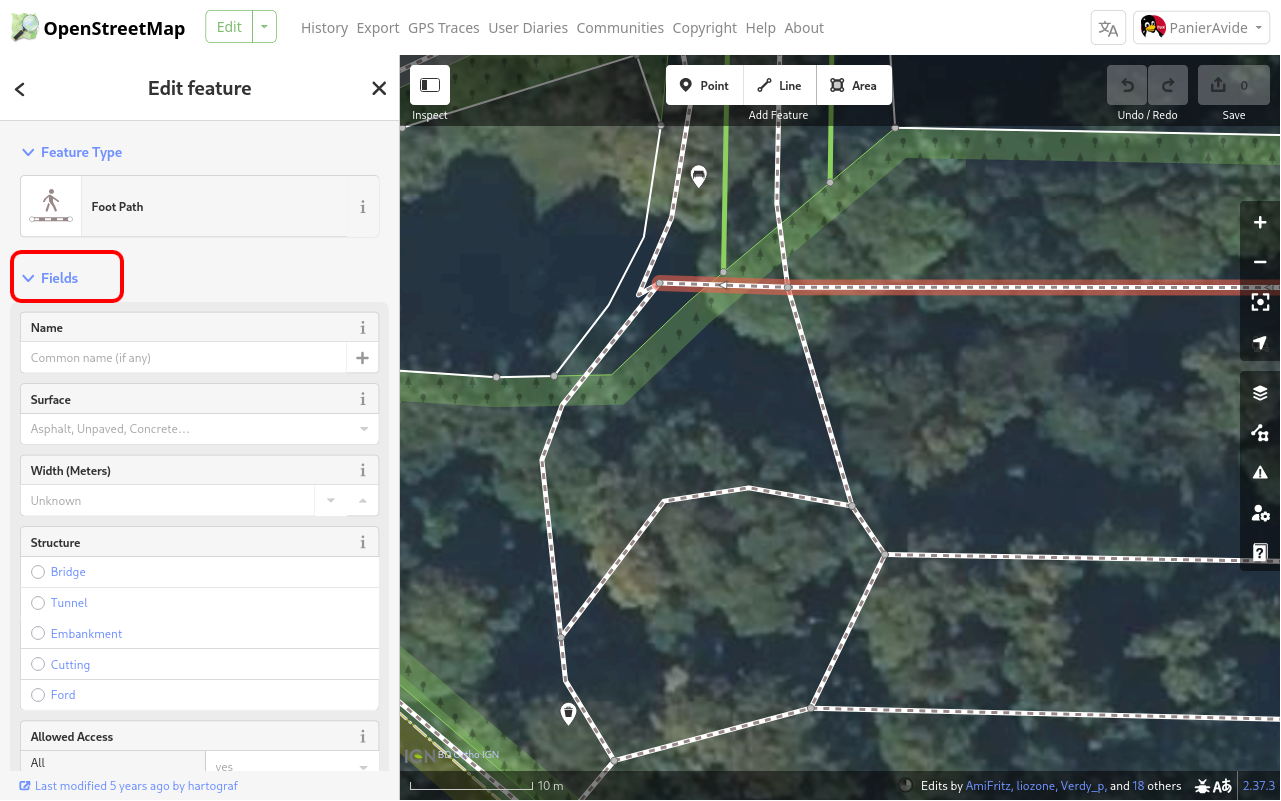
Beyond adding the features themselves, you can provide additional details to improve the accuracy of the indicators. For example, for a pedestrian path, specify the surface type, its accessibility for people with reduced mobility, whether it is lit, and more. These details can be entered in the fields displayed in the left-hand sidebar, which appears when you click on the feature on the map.

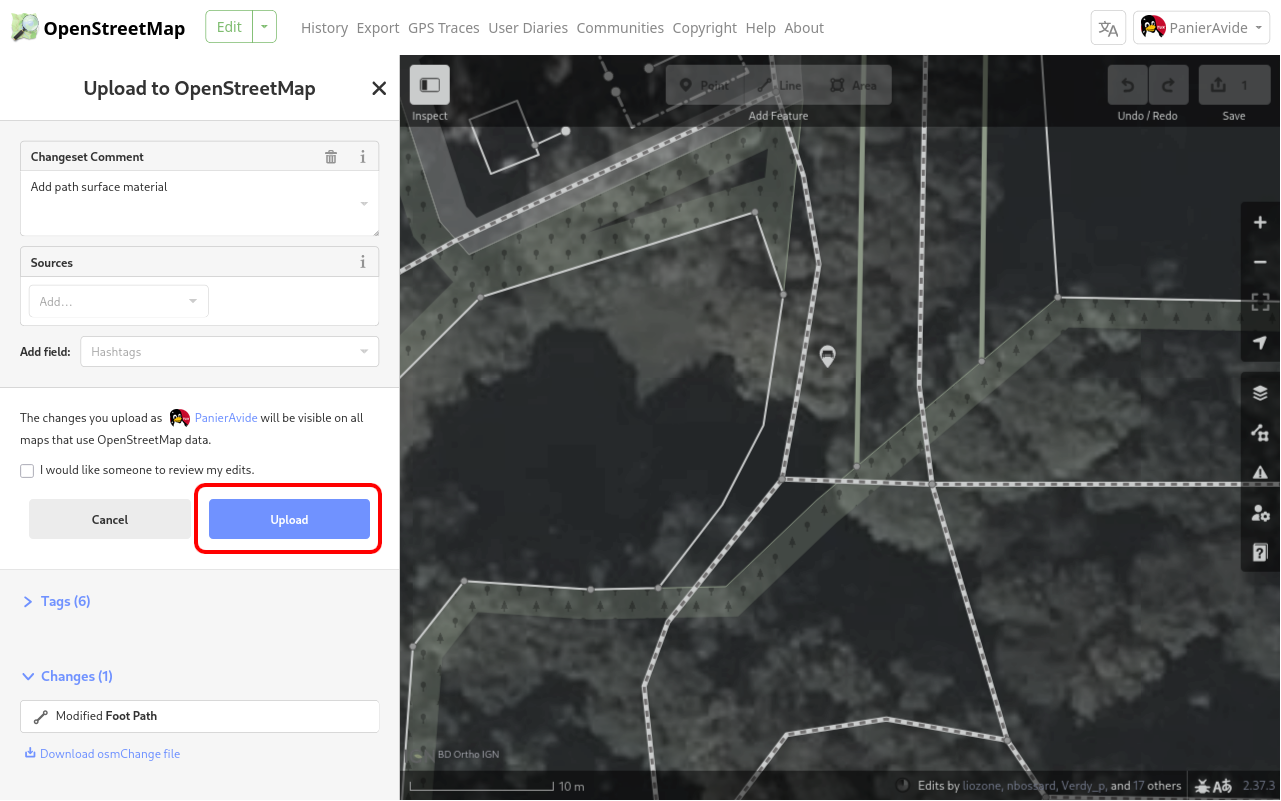
When you’ve finished making your changes, click Save (top right of the screen). In the left-hand sidebar, you’ll be asked to provide a short summary of what you modified. This is considered best practice: anyone reviewing your edits should be able to understand them in just a few words. Here are some examples of clear comments:
Once you’ve entered your summary, click Upload to submit your changes.

Once your changes are uploaded, they are immediately applied to OpenStreetMap. However, updates across different tools may take some time:
No further action is required—this is the normal process for propagating updates throughout the OpenStreetMap ecosystem.
The data used to calculate green space indicators is participatory, and you can help enrich and improve it!
We rely on two main sources:
Our contribution form allows you to provide information that cannot be entered in OpenStreetMap, such as data on the sound and smell environment in the green space, organized events, and more.
These data can be collected by visiting the green space and observing the surroundings, but also, in some cases, by consulting documents (for example, a public transport network map) or by contacting municipal services. They relate to the green space as a whole, within its physical boundaries, which may be marked by a built element (a fence, a wall, etc.) or simply by a change in ground cover, such as the transition from grass to a paved surface.
This information helps us refine the calculation of indicators.
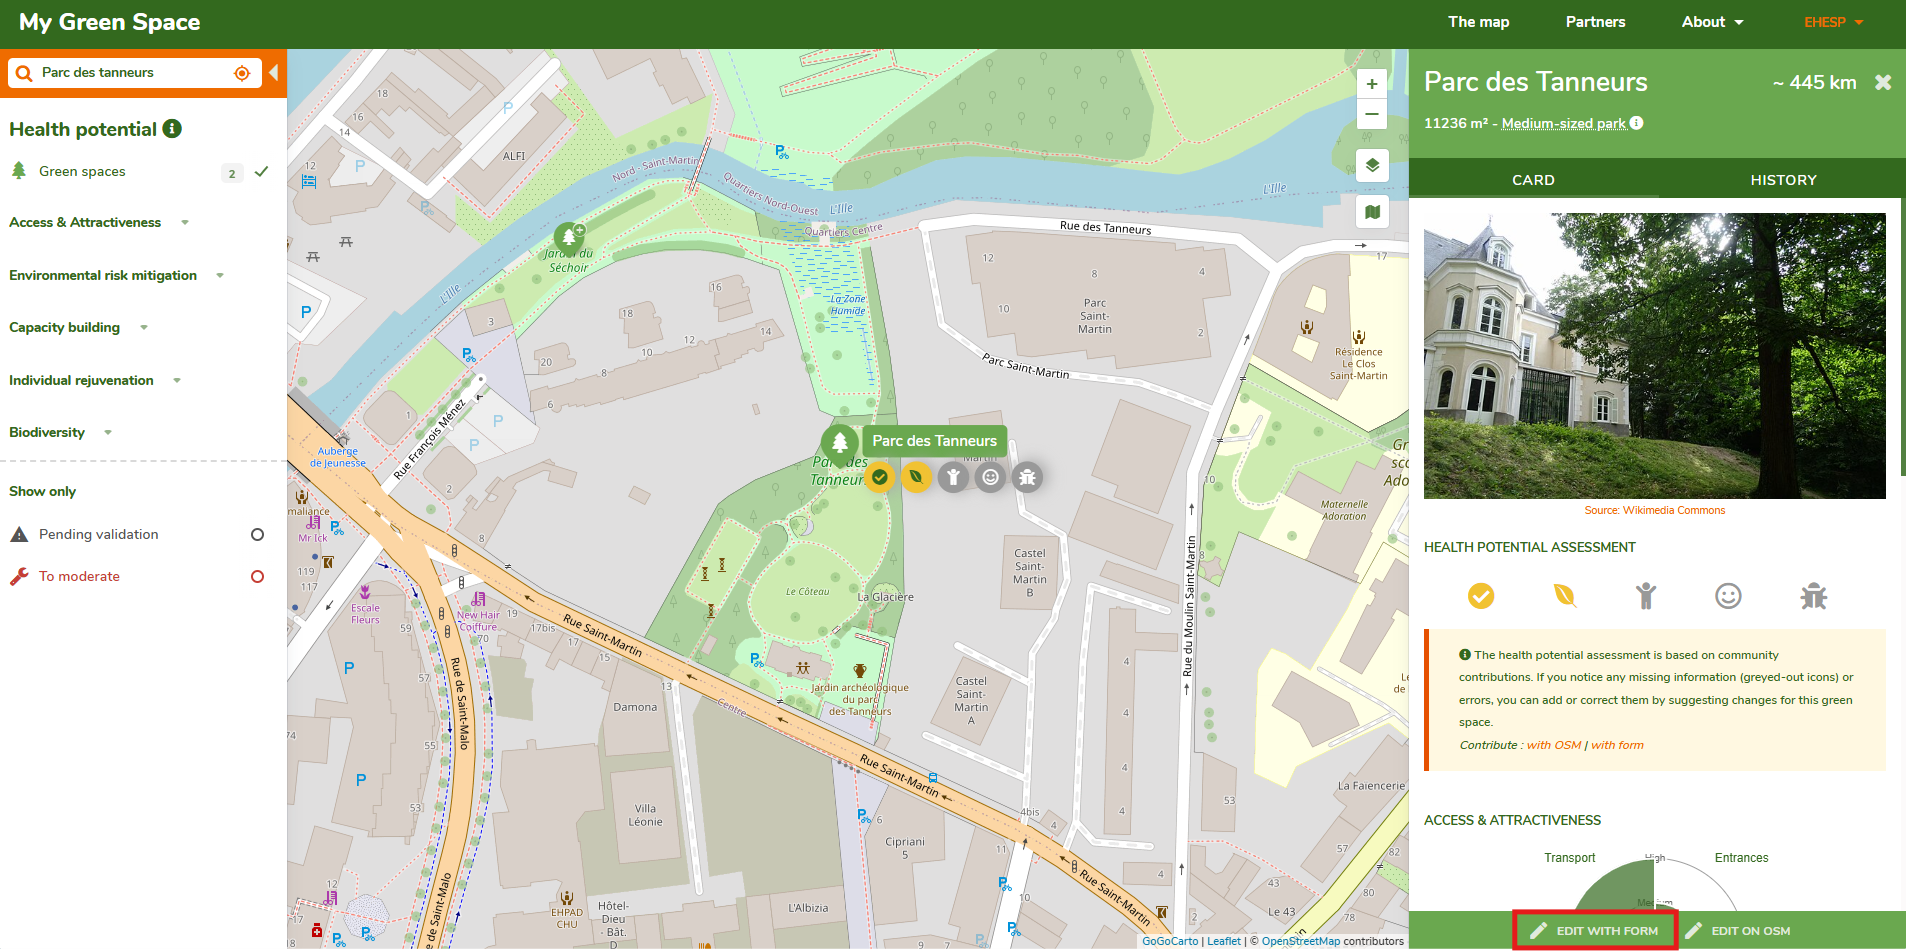
To contribute, simply select the green space of your choice and click Edit with form.

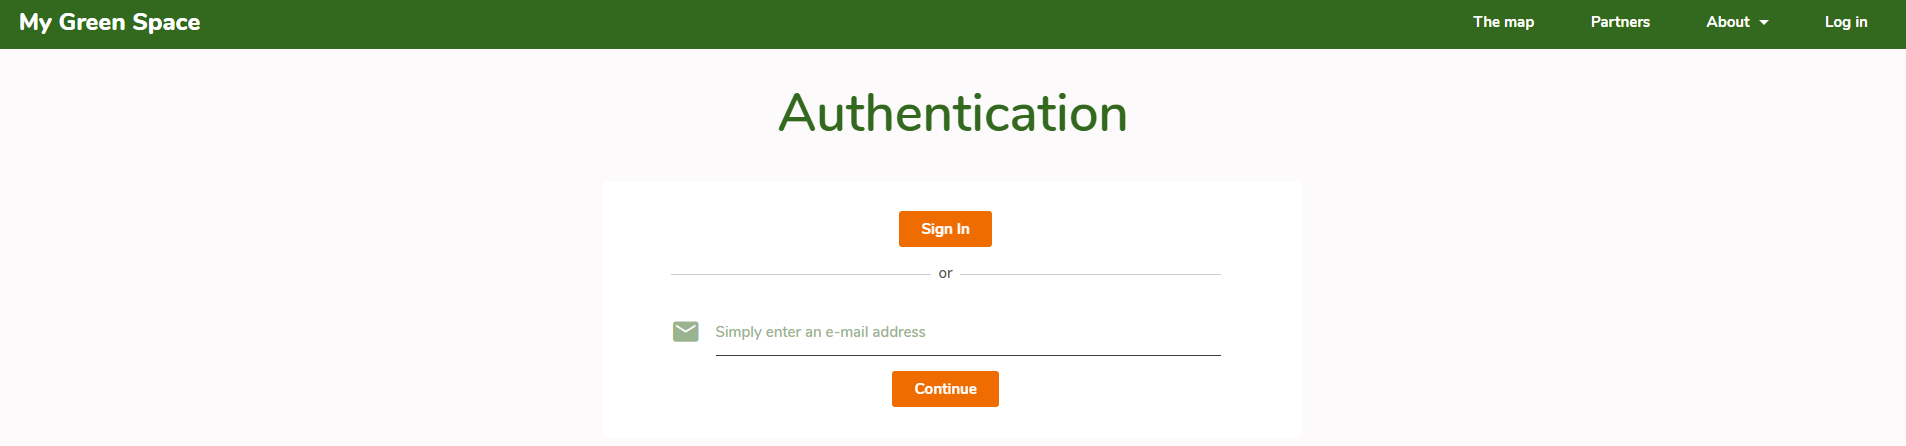
To make changes, you’ll need a user account. Log in with your existing account or create one by entering your email address.

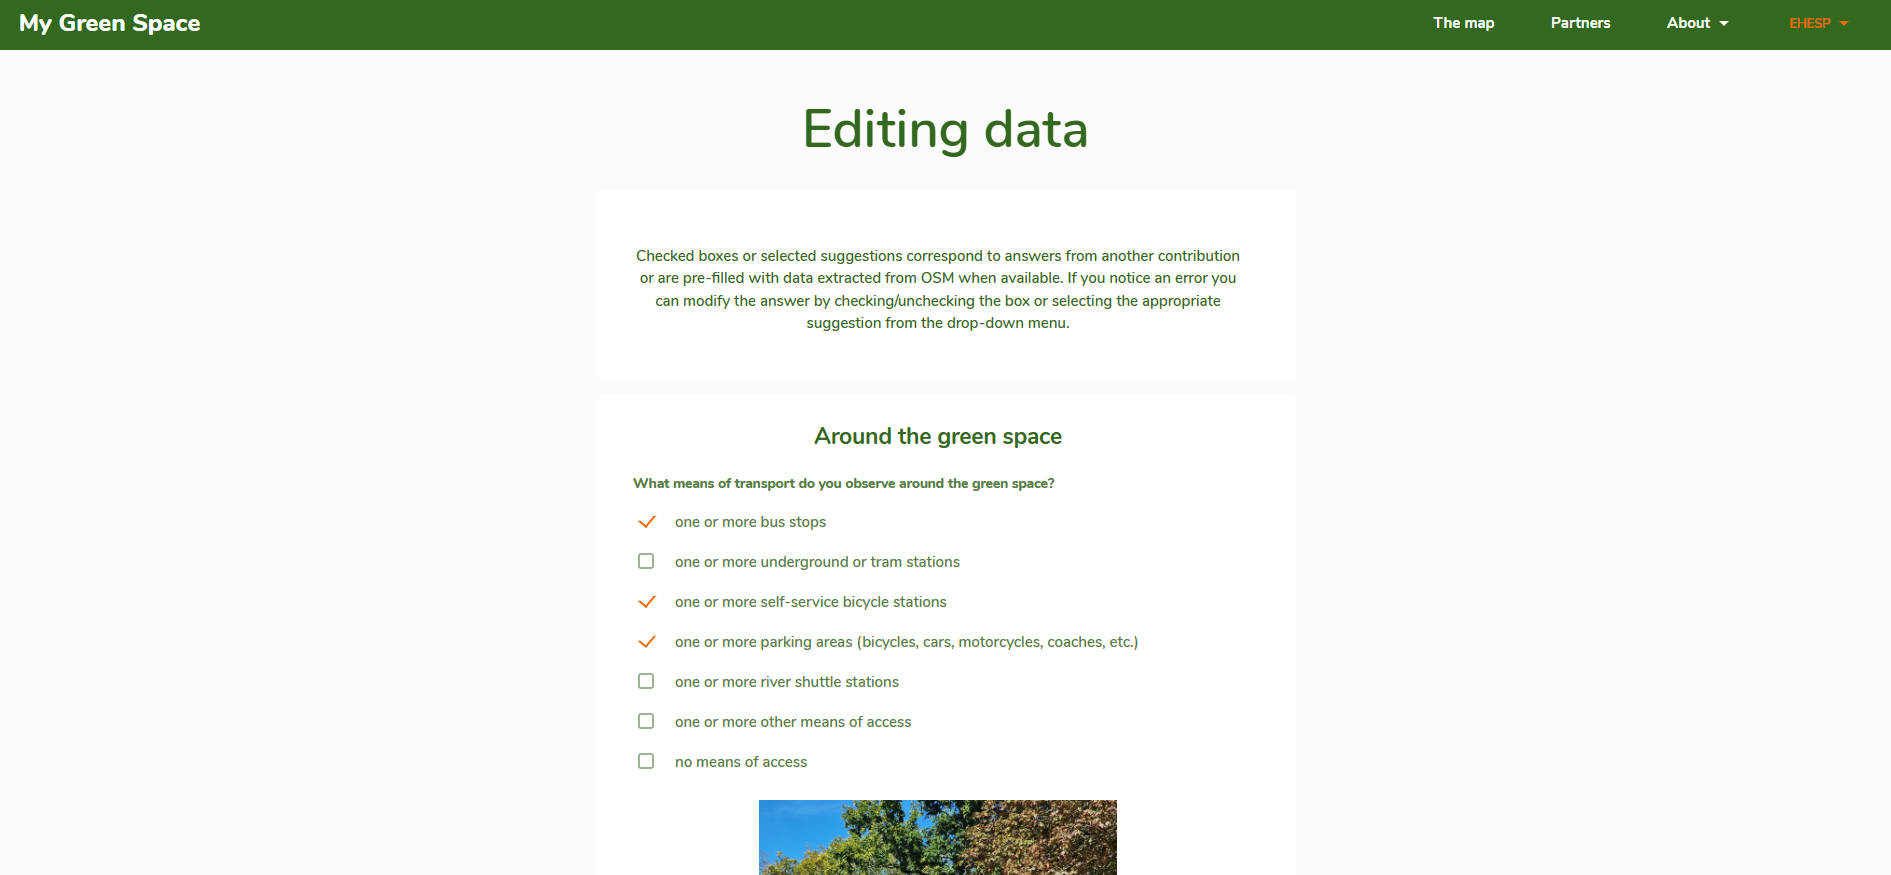
Once you’re logged in, the next page will appear. The form displays the fields you can fill in.

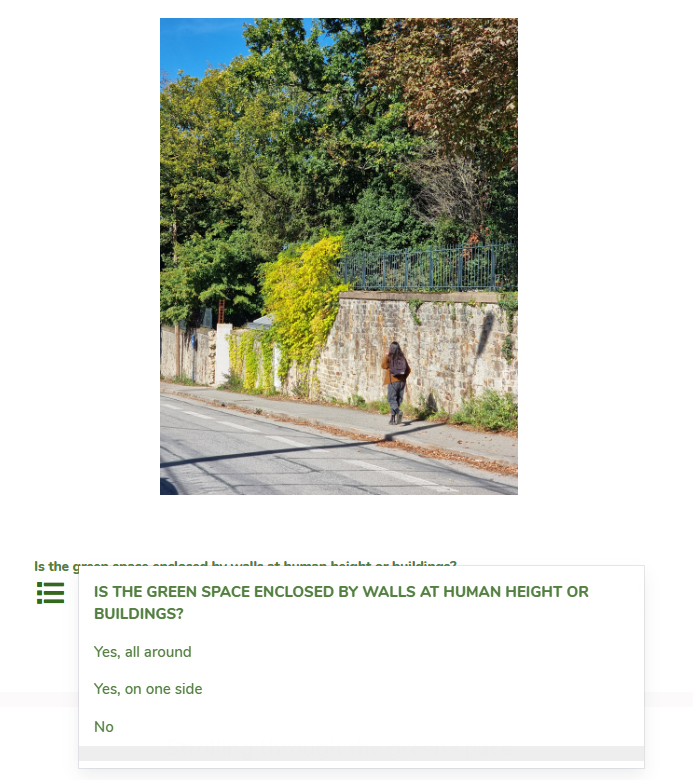
The answers you provide come in two formats:
If you’re unsure about an answer, you can leave the field blank.


Checked boxes or selected options indicate answers from previous contributions or pre-filled data from OSM when available. If you spot an error, simply update it by checking or unchecking the box, or by choosing the correct option from the dropdown menu.

When you’ve finished entering information (for all or some of the questions), click Send. The green space will then display with the updated data. Please note that some indicators are recalculated only after a few hours, or by the next day at the latest if they require cross-referencing with OpenStreetMap data. So don’t worry if certain values don’t appear immediately in the main view of the green space details.
My Green Space was born from research at EHESP (School of Public Health, Rennes, France), exploring how urban green spaces can support health and well-being. This initiative brings together a multidisciplinary team at the crossroads of environmental sciences and social and political sciences.
Our team includes:
The platform was developed in close collaboration with Adrien Pavie, geomatics and development entrepreneur.
We are part of UrbASEPT, a collective dedicated to Health-Promoting Urban Planning (HPUP) at the French School of Public Health. This approach places urban planning and development choices at the core of well-being, public health, environmental sustainability, and climate resilience.
Lorsqu'un élément est ajouté ou modifié, la mise à jour des données n'est pas instantanée. L'élément va d'abords apparaître "grisé" sur la carte, et il sera alors possible à tous les utilisateurs logué de voter une et une seule fois pour cet élément. Ce vote n'est pas une opinion, mais un partage de connaissance. Si vous connaissez cet élément, ou savez que cet élément n'existe pas, alors votre savoir nous intéresse !
Au bout d'un certain nombre de votes, l'élément pourra alors être automatiquement validé ou refusé. En cas de litige (des votes à la fois positifs et négatifs), un modérateur interviendra au plus vite. On compte sur vous!
An item being entered has been saved. Do you want to resume data entry?
Note that images and files are not retained and will therefore need to be added again.
National Cancer Institute
The French National Cancer Institute is the government agency responsible for providing health and scientific expertise in the field of oncology.
Joint Action Prevent Non-Communicable Diseases
Reducing the impact of cancer and noncommunicable diseases in Europe through coordinated strategies targeting health determinants. Focusing on effective policies and societal and individual risk factors.
EU4Health Program
EU4Health is the main tool used by the European Commission to implement the European Union's health strategy.